Who I am

A Minneapolis-based web designer, information graphics specialist, and UX junkie. My passion is building things that empower and educate people, and have fun while doing it.
My background is in data visualization and cartography. I've developed 10+ years experience with web development, illustration, and interactive design.
What I Make
- Web Sites
- Educational Multimedia
- Infographics and DataVis
- Illustrations
- Wireframes and UI/UX
- Graphic Design and Branding
Tools I Use
Web Development
- HTML5/CSS3/JS
- JQuery
- Bootstrap
- Greensock
- Sublime Text
- Dreamweaver
Graphics and Multimedia
- Adobe CS (Photoshop, Illustrator)
- Inkscape
- Paint.net
- After Effects/Adobe Media Encoder
UX
- Adobe XD
Datavis
- d3.js
- Leaflet
- Microsoft Excel
Misc
- ArcGIS
- Articulate Storyline
What I've Done
Interactive Designer - Strategic Education Company
2013 - Present
- Collaborates with a diverse set of teammates to produce world-class online educational media.
- Exercises a broad skillset that includes information design, illustration, web development, UI/UX, and art direction.
- Designs web sites that are 100% responsive and WCAG 2.0 accessibility compliant.
- Directs a 6+ person offshore team.
Freelance Graphic Designer
2009 - 2015
Independently produced graphics ranging from digital illustration to marketing materials to identity design. Collaborated with clients, art directors, and fellow artists to bring cool and creative ideas to life.
Project Assistant - Sea Grant Institute
2012
Applied UI design skills to develop a sophisticated, interactive data analysis tool from the ground-up. Implemented every step of the production process from data collection and transformation to design and programming.
Map Designer - University of Wisconsin Cartography Lab
2011 - 2012
Employed knowledge of ArcGIS and Adobe CS to produce commissioned maps and other information graphics. Became the go-to person in the department for expertise on typography, color, and layout.
Research Intern - Welsh Companies
2008
Maintained a large set of spatial data using multiple GIS software. Assisted sales team by producing maps and other research material with lightning-quick turnaround.
Education
University of Wisconsin - Madison
Master of Science, Cartography and Geographic Information Systems
University of Wisconsin - La Crosse
Bachelor of Science, Geography and Geographic Information Systems
Capella University
Web Development | Multimedia | Information Design | Offshore Management
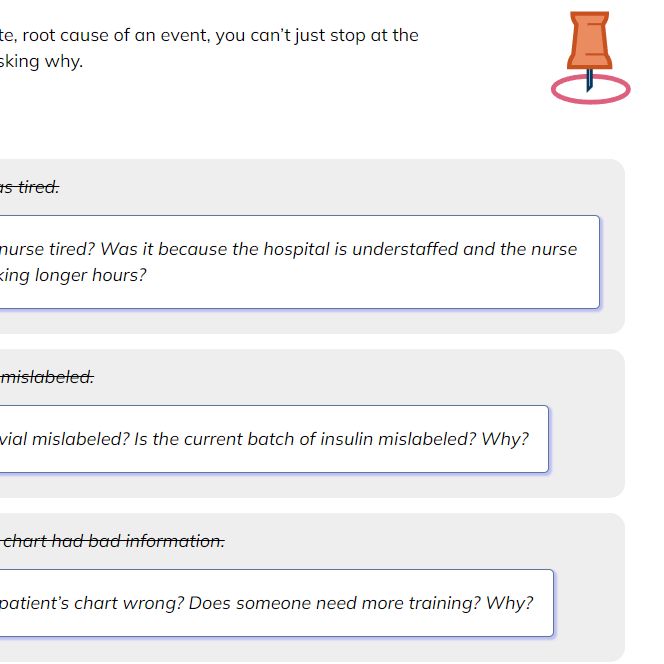
There is no one-size-fits-all approach to learning. To make world-class educational media, it requires building everything from quizzes to video presentations, gamified apps and infographics from scratch. But when you're producing hundreds of media pieces each year, it's also vital to collaborate with other designers and developers to create and maintain templates and design systems.
Dynamic Bar Chart

Simple Narrative

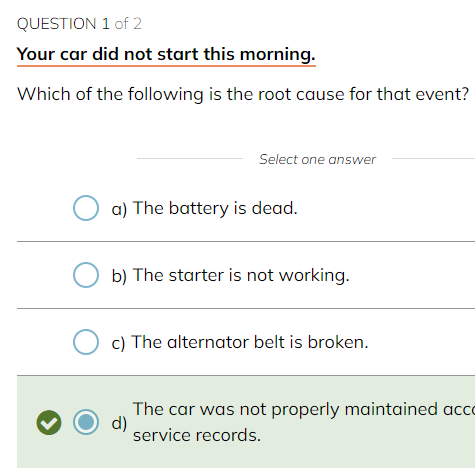
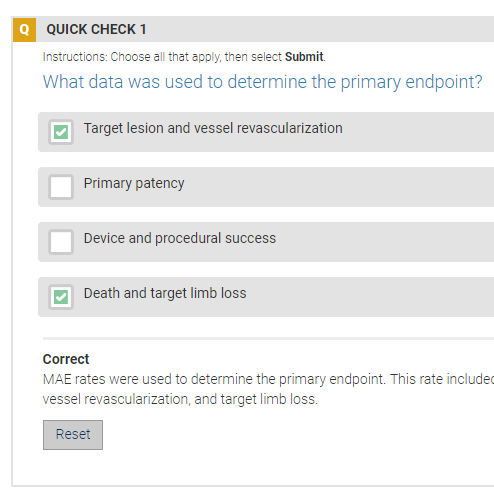
Multiple Choice Quiz

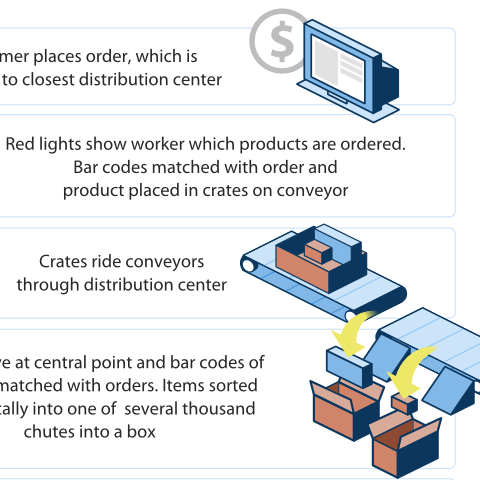
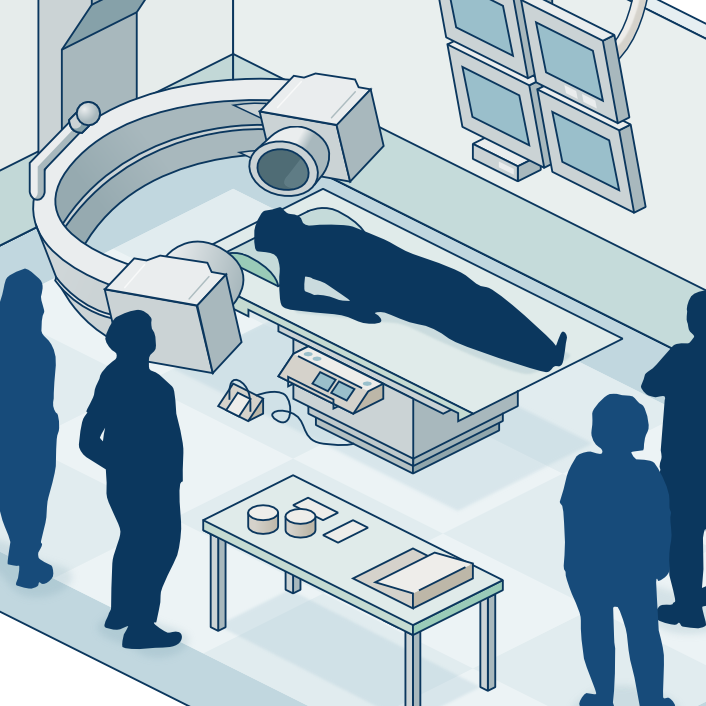
Isometric Illustration

American Nursing Association
Vector Illustration | Quality Assurance
This project challenged nursing managers to navigate difficult interpersonal business decisions... from the comfort of their computer or tablet. The illustration style had to feel relatable and create empathy, without straying too far into the cartoony.
Scenario-based Learning

Scenario-based learning | Small screen size

Character Illustrations

Medtronic
Web Development | Technical Illustration | Client Work | Multimedia
Designed for medical device sales personel. As a project lead, I had to handle the highly technical subject matter as well as foster collaboration between interactive designers, instructional designers and subject matter experts.
Isometric/technical Illustration

Product Exploration

Product Exploration - Interactive Widgets

Capella Applied Leadership Series
Art Direction | Production Design | UI Design | Web Design
A small breakaway team rescued this project from bad visual design and UX. We had to develop a new visual look and responsive interactives from scratch, as well as create many video lessons using rapid authoring tools.
Standalone Activity

Video Presentation

Card Sort Activity

Cartography
Information Design | GIS | Programming | Statistics
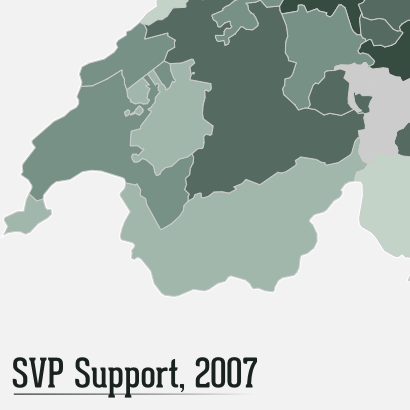
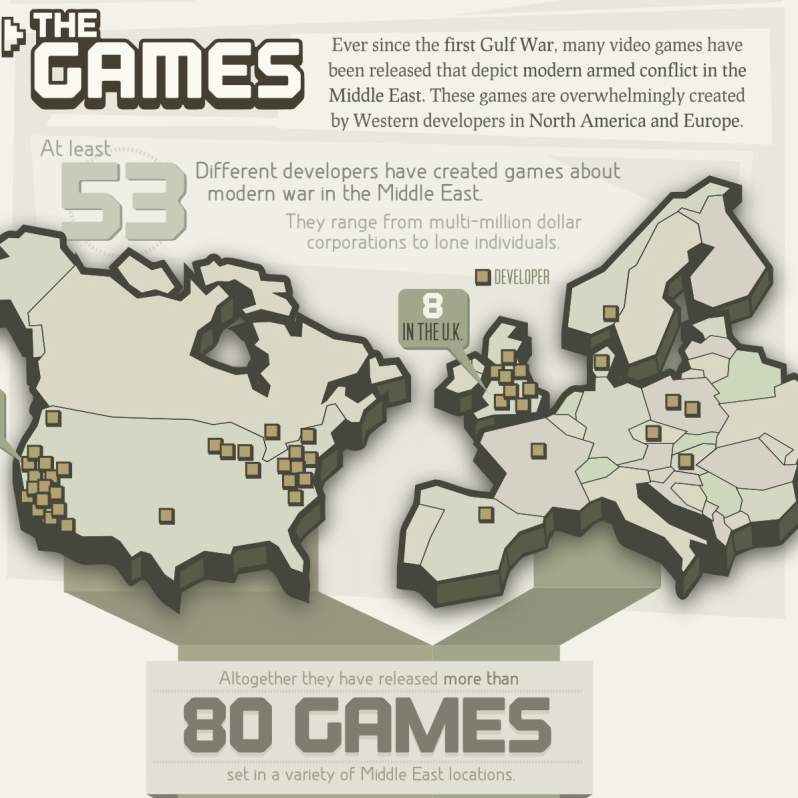
Mapmaking is a wonderful challenge. You need to understand statistics and how to display quantitative data; but you also need to act with social responsibility towards what is often serious subject matter. All the while, of course, making it interesting and engaging.
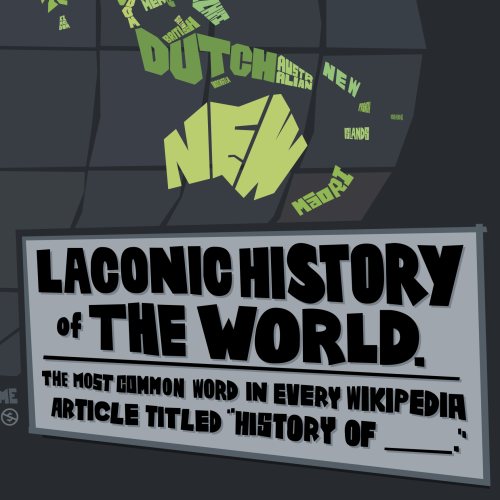
Laconic History of the World - Vector Cartography, Personal Project

Freelance Illustration
Vector Illustration | Graphic Design | Client Work | Brand Building
Sometimes you just wanna cut loose and make something weird and artsy. I was fortunate to be able to build a freelance presence where I could make cool t-shirts and develop a personal style. In vectors we trust.
Nefarious - Card Game Illustrations


"Best Friend" - Digital Illustration, T-shirt Design

"Making Friends" - Digital Illustration, Limited Edition Print

Cartography and Virality
Web 2.0 has revolutionized the way maps are disseminated. This talk examined the most internet-famous maps of recent memory in the hopes of better understanding how cartographers should adapt to the share-driven world of internet culture. Featured at Wired.com. Presented at NACIS Annual meeting 2013 and University of Minnesota GISSO career fair, 2014.
Symbol Considerations for Bivariate Thematic Maps
The results of my thesis research, which user tested various methods for representing multiple quantitative datasets on one map. Presented at ICC Dresden 2014 and NACIS annual meeting 2012.
Symbol Considerations for Bivariate Thematic Maps (pdf, 3.3mb)
Graphical Embellishments
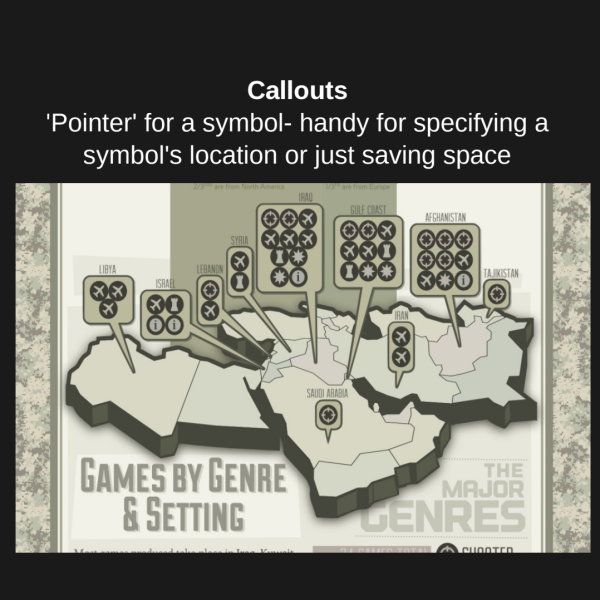
A guest lecture that cataloged various graphical embellishments common in cartography. This talk discussed how these techniques can be used not only to enhance and develop the map's aesthetic, but also make the information on the map easier to read. Presented as a guest lecture for GEO370 (Intro to Cartography), University of Wisconsin - Madison.
Atlas of Design
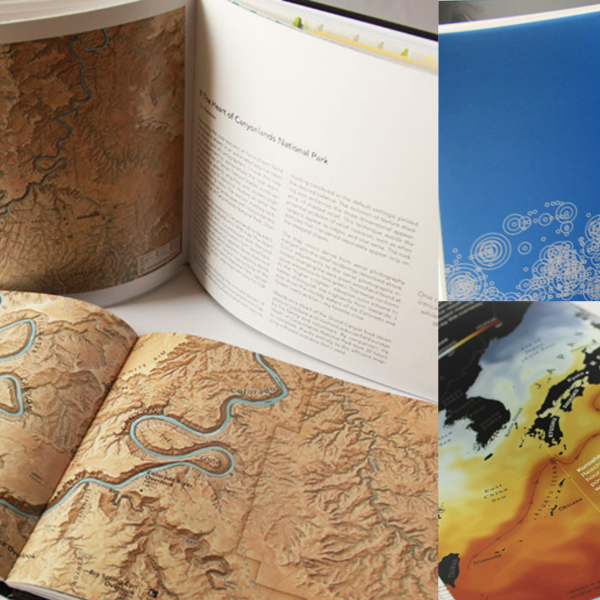
I was an assistant editor for two of the Atlas of Design's biennial editions. The Atlas is a collection of the world's most artful cartography, organized by NACIS. Tasks included organizing submissions and judging, website maintenance, layout design, and various promotional and fulfillment duties.


